The EFC Sub-Committee on EU Sovereign Debt Markets provides since 2005 regular updates on key features of the EU government debt securities markets (both euro area and non-euro area). The information on this page is updated annually on the basis of data collected from Member States (see the list of national institutions).
The data and charts below have been last updated as of December 2024, based on contributions from ESDM Members.
Size of the EU government debt markets
Table I: Total government debt securities outstanding
Table I provides the value of total debt outstanding updated yearly broken down into the issuance’s currency denomination (Domestic Currency, EUR, USD, Other) as of December 2024.
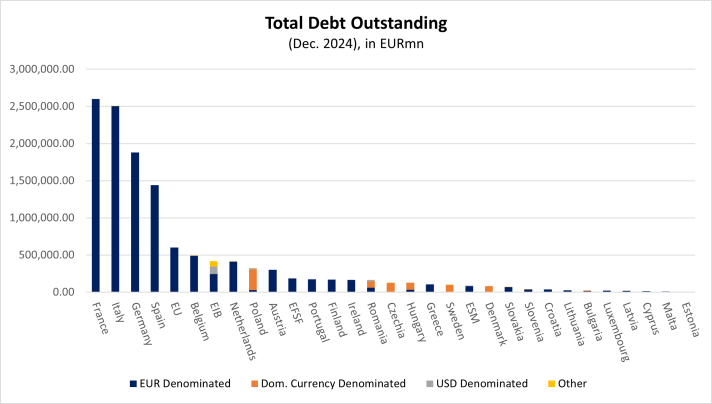
Table II: Issuance information
The following datasets provide issuers’ gross and net issuances, with respective coupon types and maturity, and the total outstanding debt. The variable names underwent modification in 2024, as documented in the mapping table.
This first dataset compiles the total outstanding government debt as of the end of the year and gross and net issuances in a given year, by currency denomination (national or foreign currencies).
This second dataset compiles issuers’ percentage of gross issuance by maturity in a given year, with their respective coupon types, for both national and foreign currencies.
Table III.A: Issuance calendars and primary dealer systems
Table IIIA summarises the issuance calendars and the primary dealer systems employed by issuers such as the number of primary dealers for bills and bonds.
The chart below displays the count of responses to whether issuers use Primary Dealership Systems as of December 2024.
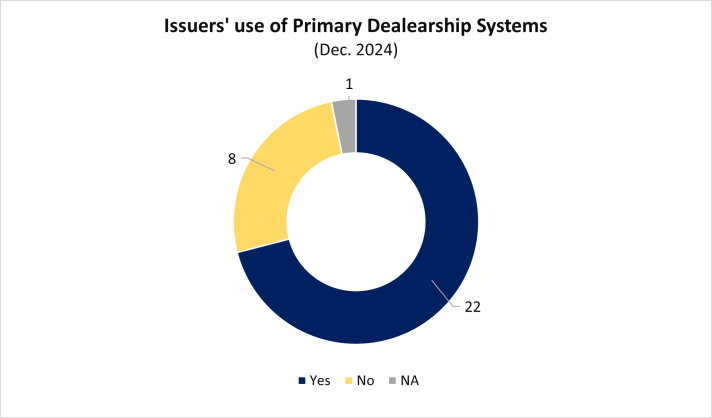
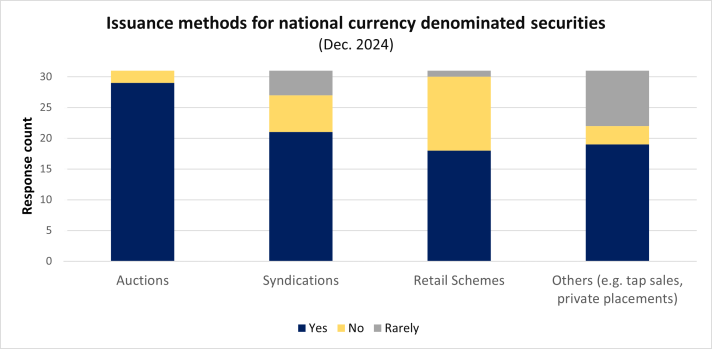
Table III.B: Issuance techniques
Table IIIB summarises the issuers’ issuance techniques for securities denominated in foreign national and foreign currencies (Auctions, Syndication, Retail Schemes & Others).
The chart below displays the issuance method response count for national currency denominated securities as of December 2024.
Risk management
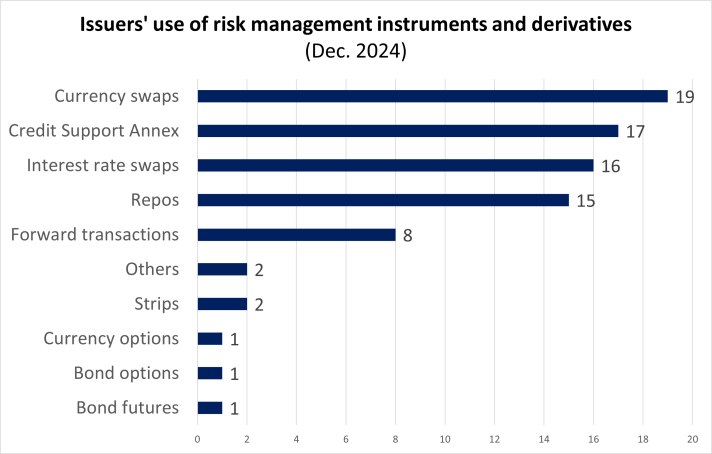
Table IV: Risk management instruments
Table IV summarises the availability and use of risk management instruments and derivatives by type of instrument and their dominant trading place.
The chart below summarises the issuer use of risk management instruments and derivatives by instrument type as of December 2024.
Convergence of market practices
Table V: Market conventions
This table summarizes the market conventions for Treasury Bills and Bonds, as regards to the day count basis (ACT, 360, etc.), the quotation basis (decimals, yield, or price), the number of days for settlement in primary and secondary markets, and the coupon frequency for Treasury Bonds.
The chart below summarises the coupon frequencies employed by issuers for treasury bonds as of December 2024
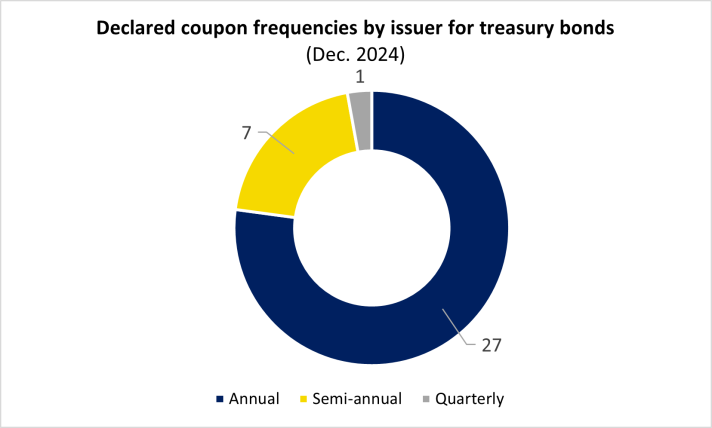
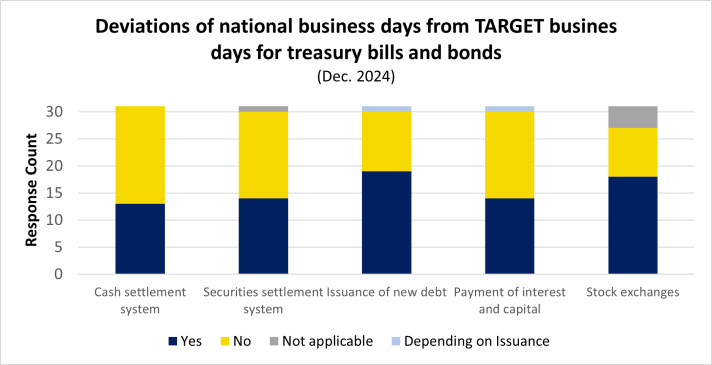
Table VI: Business days
Table VI summarises the deviations of national business days from TARGET business days for treasury bills and bonds (end-2024).
The chart below summarises the response count for deviations from TARGET by market convention as of December 2024.
Institutional structure
Table VII.A: National institutions involved in government debt management, issuance and market supervision
Table VII.B: National and international institutions involved in government debt trading, depository/registry and settlement